Prometheus + Grafana
如果购置了多台服务器,就需要一个服务器监控程序来查看它们的运行状态
最开始我是用的是探针,如那吒监控、ServerStatus
但是哪吒监控经常出各种 bug,ServerStatus 依靠大佬们个人维护,有好几个已经停更了
于是想重新找一个开源工具搭建
Grafana + Prometheus + node_exporter 就是一个非常好的服务器状态监控解决方案
- node_exporter 运行在客户极上,将收集到的系统数据按格式整理好放在网页上
- Prometheus 定期到客户机收集数据,按时间序列保存
- Grafana 从 Prometheus 读取数据,将数据按时间序列显示为图表等形式
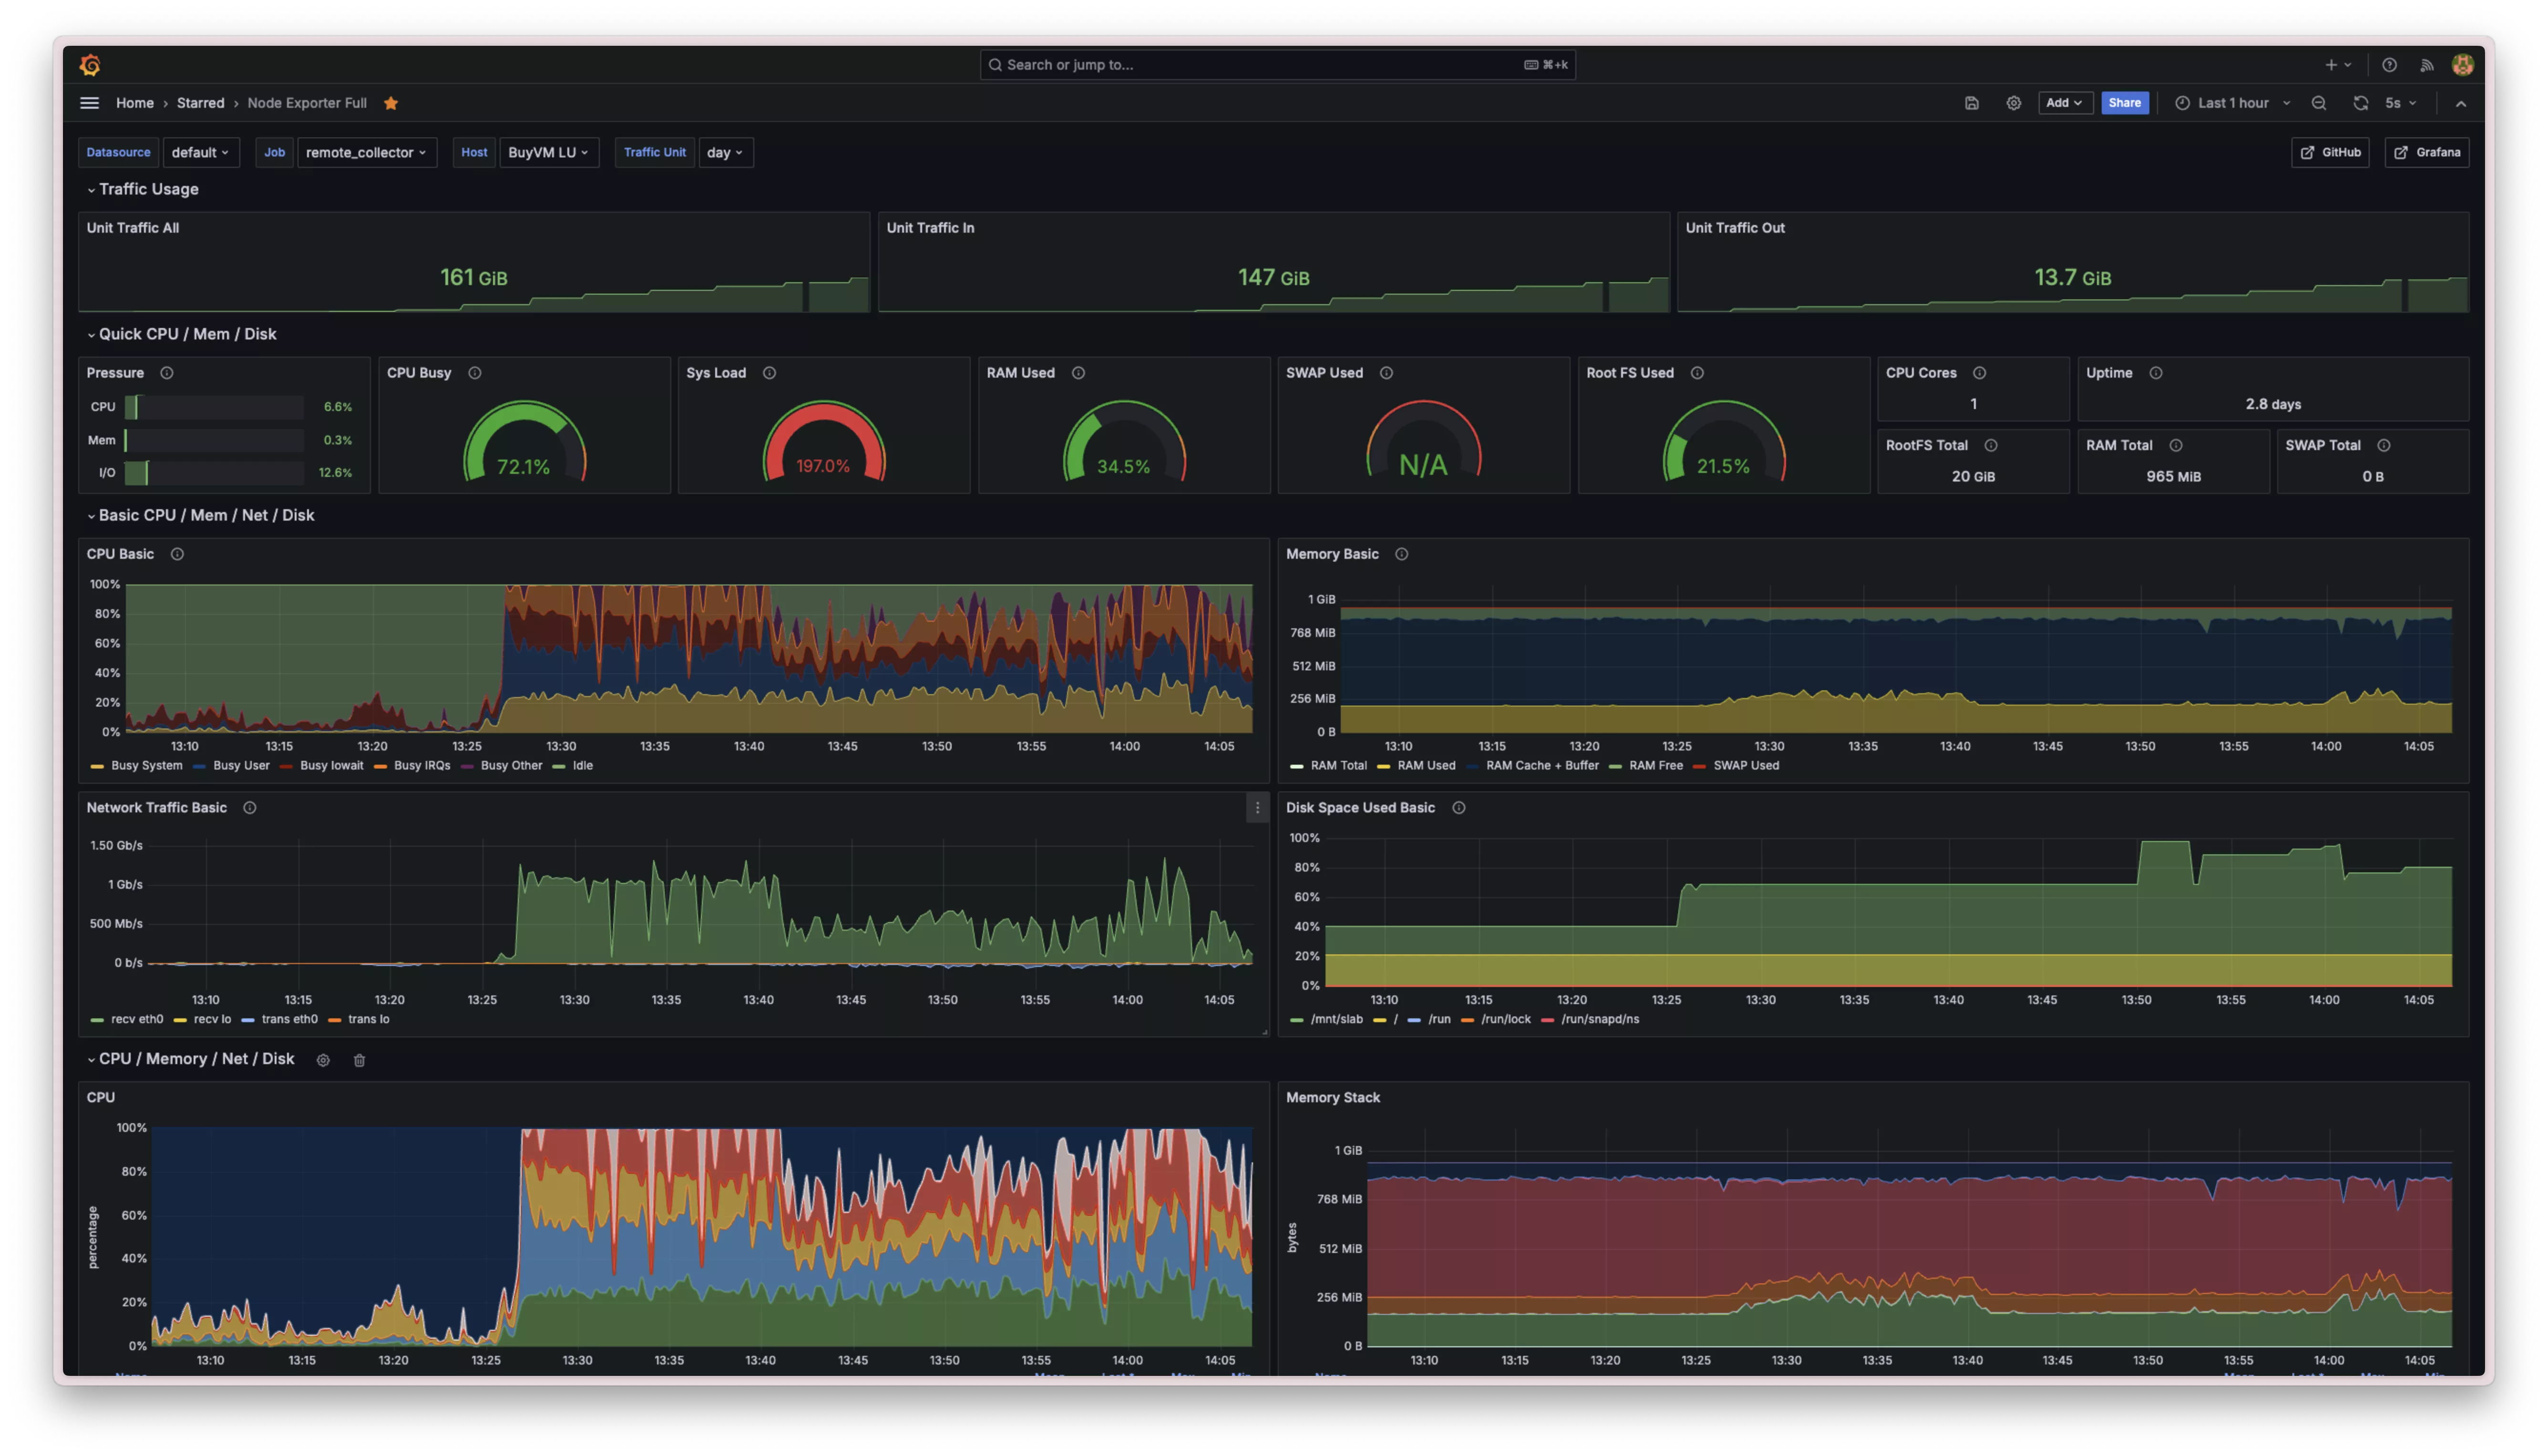
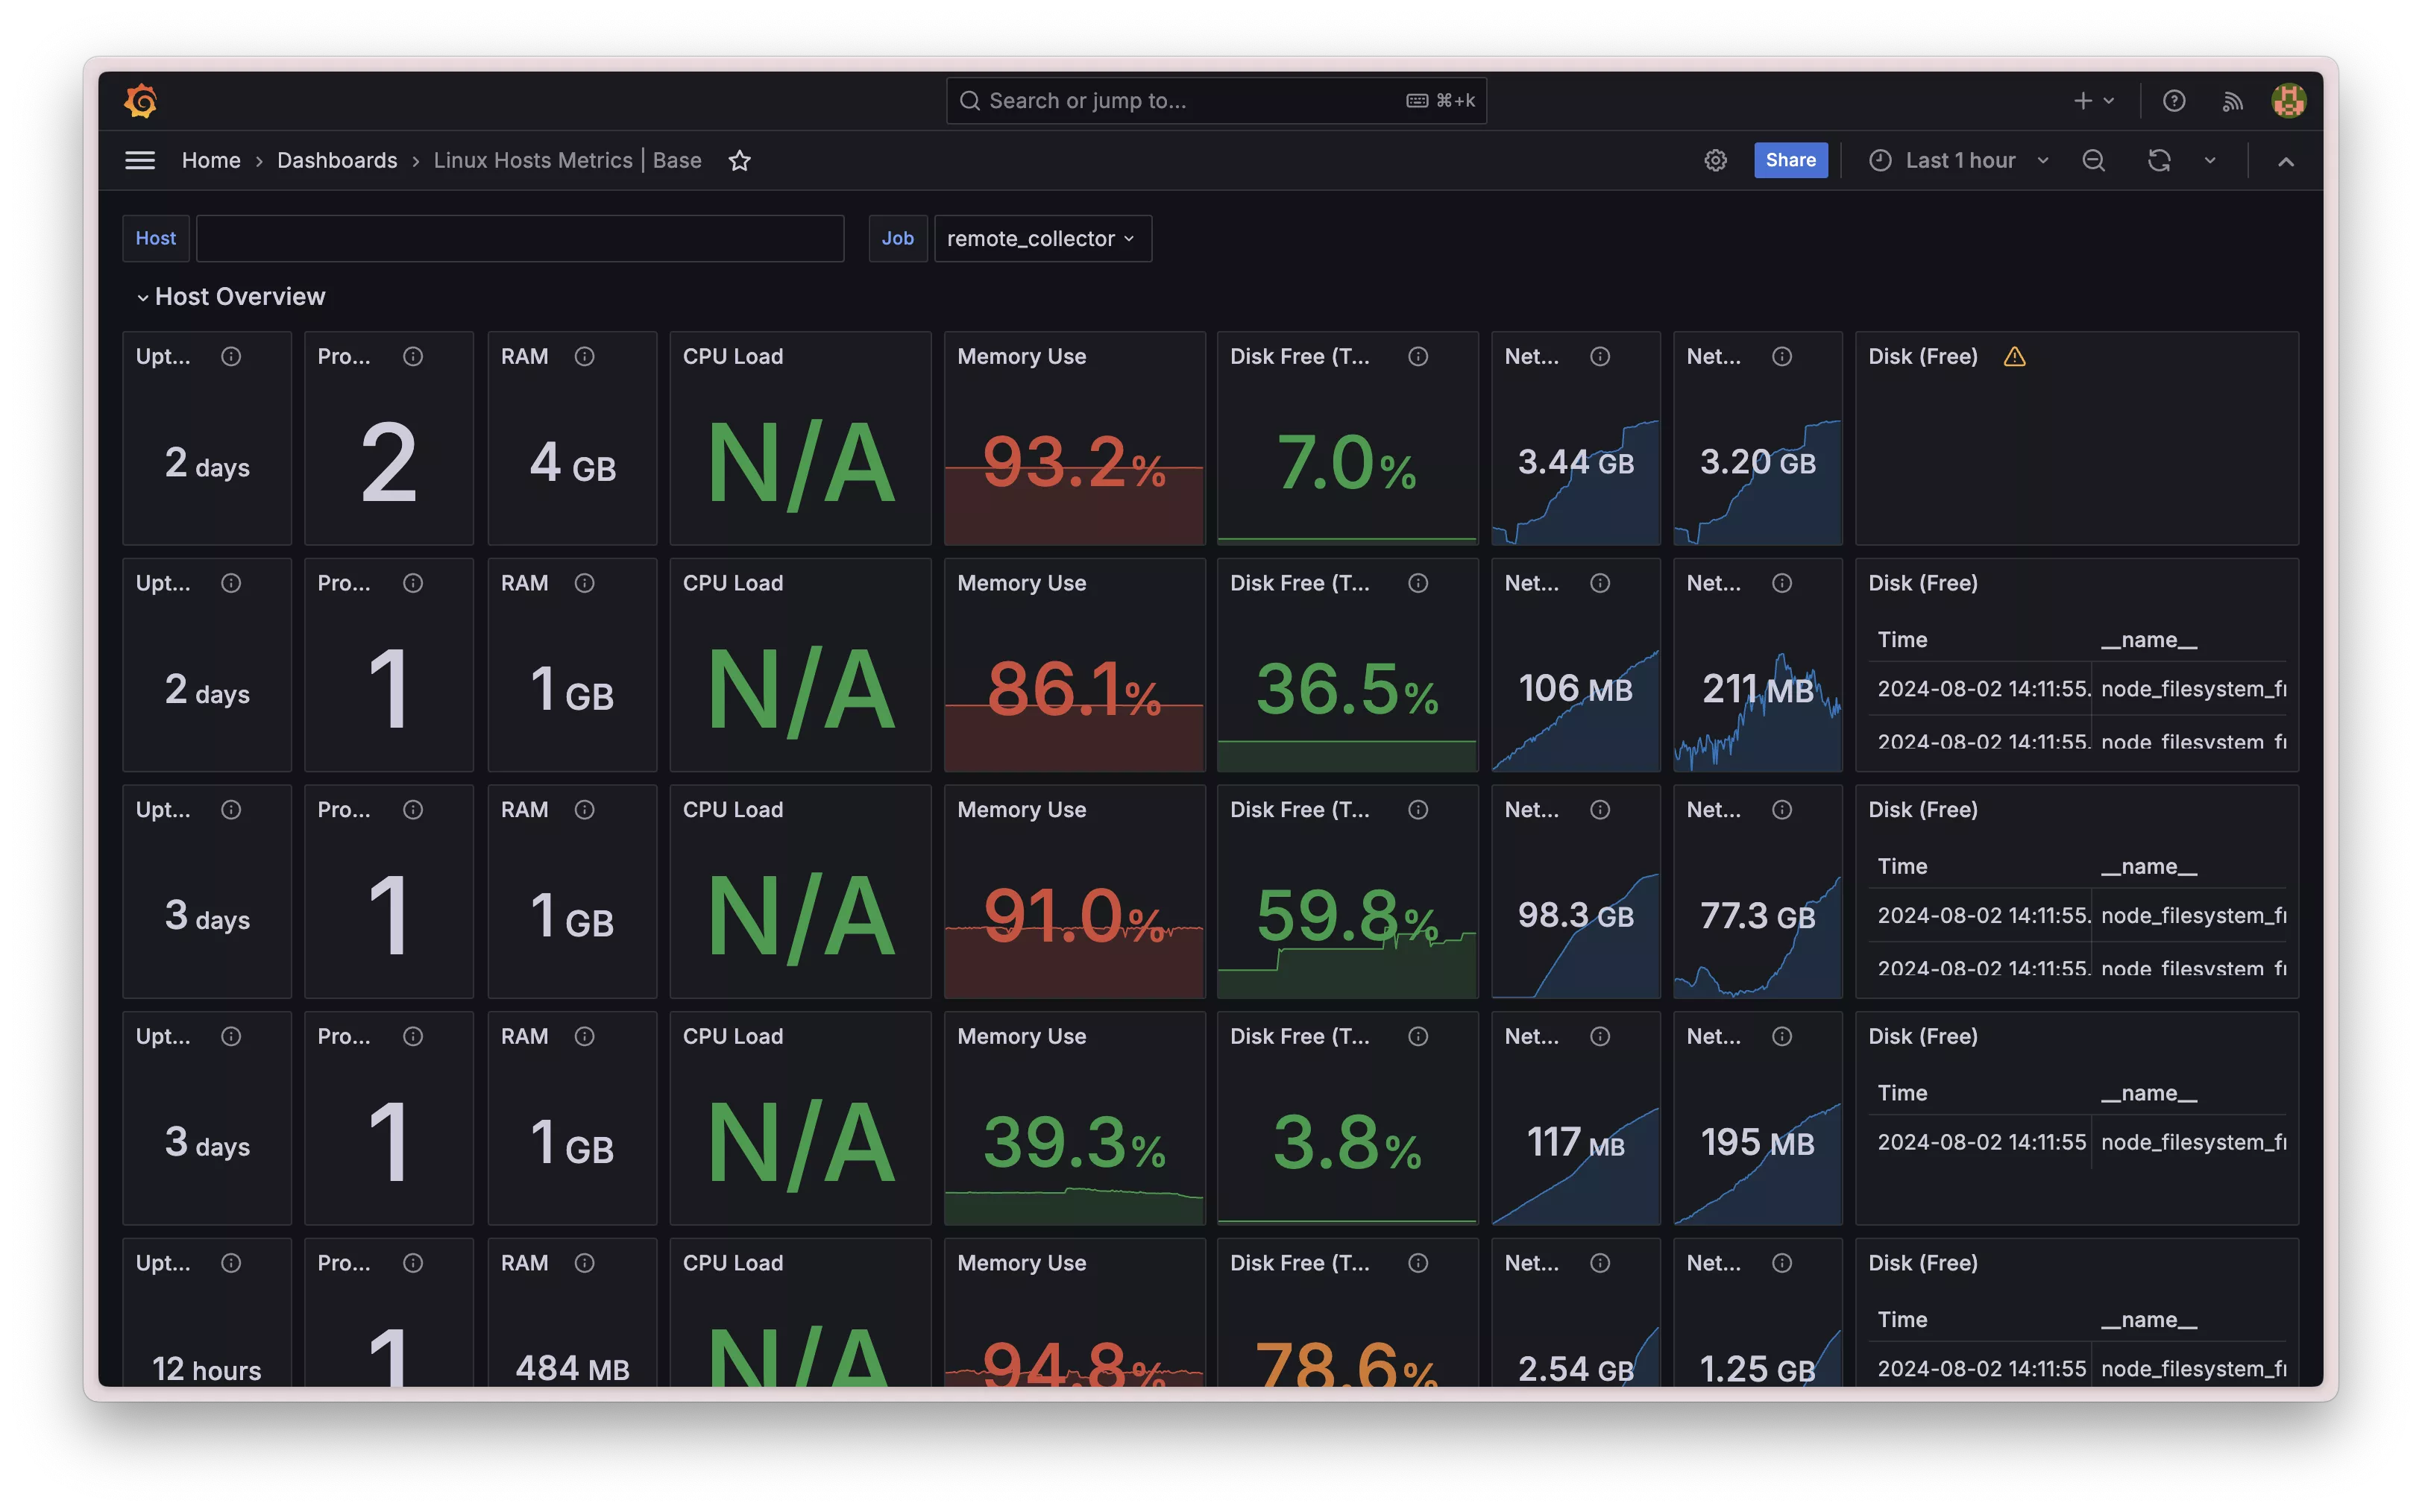
实现效果
Install
apt update
apt install ufw
ufw allow 22
ufw enable
(Clients) node_exporter
Latest Release · prometheus/node_exporter
用最新版本替换
在每个客户机上执行以下内容
wget https://github.com/prometheus/node_exporter/releases/download/v1.8.2/node_exporter-1.8.2.linux-amd64.tar.gz tar -xzvf node_exporter-1.8.2.linux-amd64.tar.gz sudo mv node_exporter-1.8.2.linux-amd64/node_exporter /usr/local/bin rm node_exporter-*.tar.gz rm -r node_exporter-*.linux-amd64* sudo useradd -rs /bin/false node_exporter vim /etc/systemd/system/node_exporter.service[Unit] Description=node_exporter Wants=network-online.target After=network-online.target [Service] User=node_exporter Group=node_exporter Type=simple Restart=on-failure RestartSec=5s ExecStart=/usr/local/bin/node_exporter [Install] WantedBy=multi-user.targetsudo systemctl daemon-reload sudo systemctl enable --now node_exporter sudo systemctl status node_exporter此时可以使用
<Server IP>:9100/metrics查看导出的数据ufw allow from <Server IP> to any port 9100 comment 'node_exporter'
(Server) Prometheus
Prometheus 官网:Prometheus
Prometheus Latest Release:Latest Release · prometheus/prometheus
用最新版本替换
wget https://github.com/prometheus/prometheus/releases/download/v2.53.1/prometheus-2.53.1.linux-amd64.tar.gz tar -xzvf prometheus-2.53.1.linux-amd64.tar.gz cd prometheus-2.53.1.linux-amd64 sudo mv prometheus promtool /usr/local/bin/ sudo mkdir -p /etc/prometheus /var/lib/prometheus sudo mv prometheus.yml /etc/prometheus/prometheus.yml sudo mv consoles/ console_libraries/ /etc/prometheus/ cd .. rm -r prometheus-2.53.1.linux-amd64.tar.gz rm -r prometheus-2.53.1.linux-amd64 sudo useradd -rs /bin/false prometheus sudo chown -R prometheus: /etc/prometheus /var/lib/prometheus vim /etc/systemd/system/prometheus.service[Unit] Description=Prometheus Wants=network-online.target After=network-online.target [Service] User=prometheus Group=prometheus Type=simple Restart=on-failure RestartSec=5s ExecStart=/usr/local/bin/prometheus \ --config.file /etc/prometheus/prometheus.yml \ --storage.tsdb.path /var/lib/prometheus/ \ --web.console.templates=/etc/prometheus/consoles \ --web.console.libraries=/etc/prometheus/console_libraries \ --web.listen-address=0.0.0.0:9090 \ --web.enable-lifecycle \ --log.level=info [Install] WantedBy=multi-user.targetsudo systemctl daemon-reload sudo systemctl enable --now prometheus sudo systemctl status prometheus此时可以通过
http://<Server IP>:9090访问 Prometheus 仪表盘ufw allow 9090 comment 'prometheus'
(Server) Add Clients to Server
每次添加客户机时按以下方式更新 Prometheus
vim /etc/prometheus/prometheus.ymlscrape_configs: # The job name is added as a label `job=<job_name>` to any timeseries scraped from this config. - job_name: "prometheus" # metrics_path defaults to '/metrics' # scheme defaults to 'http'. static_configs: - targets: ["localhost:9090"] # 添加以下内容 - job_name: "remote_collector" scrape_interval: 1m static_configs: - targets: ["<Client 1 IP>:9100", "<Client 2 IP>:9100"] relabel_configs: - source_labels: [__address__] target_label: instance replacement: '<Client 1 Name>' regex: '<Client 1 IP>:9100' - source_labels: [__address__] target_label: instance replacement: '<Client 2 Name>' regex: '<Client 2 IP>:9100'systemctl restart prometheus前往
<Server IP>:9090, Status, Targets,将显示所有 Clients
(Server) Grafana
sudo apt-get install -y apt-transport-https software-properties-common wget
sudo mkdir -p /etc/apt/keyrings/
wget -q -O - https://apt.grafana.com/gpg.key | gpg --dearmor | sudo tee /etc/apt/keyrings/grafana.gpg > /dev/null
echo "deb [signed-by=/etc/apt/keyrings/grafana.gpg] https://apt.grafana.com stable main" | sudo tee -a /etc/apt/sources.list.d/grafana.list
sudo apt-get update
sudo apt-get install grafana
systemctl daemon-reload
systemctl enable --now grafana-server.service
systemctl status grafana-server
ufw allow 3000 comment 'grafana'- 此时可以通过
<Server IP>:3000访问 Grafana
(Server) Link Grafana and Prometheus
- 浏览器访问
<Server IP>:3000,初始用户名和初试密码均为admin,登录成功后修改密码 - 点击左上角三横线,展开
Connections,点击Data sources - 点击
Add data source,Prometheus- URL:
http://localhost:9090
- URL:
- 点击
Save & test - 点击左上角三横线,
Dashboards,New,Import - 输入 ID,如
1860,点击Load,底部选择数据源为 Prometheus,点击Import - 完成,现在可以通过
<Server IP>:3000查看仪表盘
Traffic Statistics: vnstat
使用 Grafana + Prometheus + node_exporter 可以实时监控客户端传递的数据,对各种实时数据的监控效果良好
然而,对于需要进行时间段汇总的任务,如流量统计等,效果非常有限,而且数据和实际值差别较大
由于其仅记录每个时间点的数据,无法像数据库那样根据客户端传输的数据更新每个时段的流量信息
因此,我采用 vnstat 进行流量信息统计,然后导出给 Prometheus,从而在 Grafana 面板上展示
但是我找了一圈没有找到 vnstat Exporter,只好自己手搓了一个,实现的效果略显粗糙,仅供参考
(Clients) vnstat
Install vnstat
vnstat 从安装完成后开始统计流量信息,每五分钟更新一次,如果还没有信息就稍等一会apt install vnstat systemctl enable vnstat按小时查看流量
此外,可以按 5 分钟 `-5`、日 `-d`、月 `-m`、年 `-y` 查看、导出为 json `--json`root@localhost:~# vnstat -h eth0 / hourly hour rx | tx | total | avg. rate ------------------------+-------------+-------------+--------------- 2024-08-01 21:00 9.07 MiB | 22.31 MiB | 31.39 MiB | 73.13 kbit/s 22:00 9.36 MiB | 22.78 MiB | 32.14 MiB | 74.90 kbit/s 23:00 10.91 MiB | 44.68 MiB | 55.59 MiB | 129.53 kbit/s 2024-08-02 00:00 118.04 MiB | 6.00 GiB | 6.11 GiB | 14.59 Mbit/s 01:00 124.24 GiB | 7.18 GiB | 131.42 GiB | 313.57 Mbit/s 02:00 45.43 GiB | 8.37 GiB | 53.80 GiB | 128.36 Mbit/s ------------------------+-------------+-------------+---------------
创建
vnstat_exporter.py脚本只成功用
prometheus_client写了一个 Python 脚本,对资源消耗较高,之后有机会重写成 Shell 脚本apt install python3-pip pip install prometheus-client vim /usr/local/bin/vnstat_exporter.pyfrom prometheus_client import start_http_server, Gauge import subprocess import json import time import argparse import re # Define metrics traffic_gauge = Gauge('vnstat_traffic', 'Traffic usage from vnstat', ['interface', 'time_unit', 'type', 'direction']) available_traffic_gauge = Gauge('available_traffic', 'Available traffic', ['available_traffic_cycle', 'available_traffic_direction']) def convert_to_bytes(traffic_str): """ Converts a traffic string (e.g. '2TB', '500GB', '250MB') to bytes. """ unit_multipliers = { 'B': 1, 'KB': 1024, 'MB': 1024**2, 'GB': 1024**3, 'TB': 1024**4, } # Match the number and the unit match = re.match(r'(\d+(?:\.\d+)?)\s*([KMGTP]?B)', traffic_str.strip()) if match: value = float(match.group(1)) unit = match.group(2) return value * unit_multipliers[unit] else: raise ValueError(f"Invalid traffic string: {traffic_str}") def parse_vnstat_output(output): """ Parses the vnstat JSON output and updates Prometheus metrics. """ data = json.loads(output) for interface in data.get('interfaces', []): iface_name = interface.get('name', 'unknown') traffic = interface.get('traffic', {}) # Process traffic data for each time unit # Process 5-minute data if available for entry in traffic.get('fiveminute', []): timestamp = f"{entry['date']['year']}-{entry['date']['month']:02d}-{entry['date']['day']:02d} {entry['time']['hour']:02d}:{entry['time']['minute']:02d}" rx = entry.get('rx', 0) tx = entry.get('tx', 0) total = rx + tx print(f"5-min data: {iface_name}, {timestamp}, rx={rx}, tx={tx}, total={total}") traffic_gauge.labels(interface=iface_name, time_unit='five_minute', type='total', direction='in').set(rx) traffic_gauge.labels(interface=iface_name, time_unit='five_minute', type='total', direction='out').set(tx) traffic_gauge.labels(interface=iface_name, time_unit='five_minute', type='total', direction='total').set(total) # Process hourly data if available for entry in traffic.get('hour', []): timestamp = f"{entry['date']['year']}-{entry['date']['month']:02d}-{entry['date']['day']:02d} {entry['time']['hour']:02d}:00" rx = entry.get('rx', 0) tx = entry.get('tx', 0) total = rx + tx print(f"Hour data: {iface_name}, {timestamp}, rx={rx}, tx={tx}, total={total}") traffic_gauge.labels(interface=iface_name, time_unit='hour', type='total', direction='in').set(rx) traffic_gauge.labels(interface=iface_name, time_unit='hour', type='total', direction='out').set(tx) traffic_gauge.labels(interface=iface_name, time_unit='hour', type='total', direction='total').set(total) # Process daily data if available for entry in traffic.get('day', []): date = f"{entry['date']['year']}-{entry['date']['month']:02d}-{entry['date']['day']:02d}" rx = entry.get('rx', 0) tx = entry.get('tx', 0) total = rx + tx print(f"Day data: {iface_name}, {date}, rx={rx}, tx={tx}, total={total}") traffic_gauge.labels(interface=iface_name, time_unit='day', type='total', direction='in').set(rx) traffic_gauge.labels(interface=iface_name, time_unit='day', type='total', direction='out').set(tx) traffic_gauge.labels(interface=iface_name, time_unit='day', type='total', direction='total').set(total) # Process monthly data if available for entry in traffic.get('month', []): date = f"{entry['date']['year']}-{entry['date']['month']:02d}" rx = entry.get('rx', 0) tx = entry.get('tx', 0) total = rx + tx print(f"Month data: {iface_name}, {date}, rx={rx}, tx={tx}, total={total}") traffic_gauge.labels(interface=iface_name, time_unit='month', type='total', direction='in').set(rx) traffic_gauge.labels(interface=iface_name, time_unit='month', type='total', direction='out').set(tx) traffic_gauge.labels(interface=iface_name, time_unit='month', type='total', direction='total').set(total) # Process yearly data if available for entry in traffic.get('year', []): date = f"{entry['date']['year']}" rx = entry.get('rx', 0) tx = entry.get('tx', 0) total = rx + tx print(f"Year data: {iface_name}, {date}, rx={rx}, tx={tx}, total={total}") traffic_gauge.labels(interface=iface_name, time_unit='year', type='total', direction='in').set(rx) traffic_gauge.labels(interface=iface_name, time_unit='year', type='total', direction='out').set(tx) traffic_gauge.labels(interface=iface_name, time_unit='year', type='total', direction='total').set(total) def update_metrics(available_traffic_cycle, available_traffic_direction, available_traffic): """ Fetches vnstat data and updates Prometheus metrics. """ try: output = subprocess.check_output(['vnstat', '--json'], text=True) print("Raw vnstat JSON output:") print(output) # Print the raw JSON data for inspection parse_vnstat_output(output) # Check if available traffic is unlimited if available_traffic == '0': # Set available traffic to infinity or a very high value available_traffic_bytes = float('inf') # 表示无限流量 else: # Convert available traffic to bytes available_traffic_bytes = convert_to_bytes(available_traffic) # Set available traffic gauge available_traffic_gauge.labels(available_traffic_cycle=available_traffic_cycle, available_traffic_direction=available_traffic_direction).set(available_traffic_bytes) except subprocess.CalledProcessError as e: print(f"Error fetching vnstat data: {e}") print(f"Command output: {e.output}") if __name__ == '__main__': # Argument parsing parser = argparse.ArgumentParser(description='vnstat exporter for Prometheus') parser.add_argument('--available_traffic_cycle', required=True, help='Cycle for available traffic (e.g. monthly)') parser.add_argument('--available_traffic_direction', required=True, help='Direction for available traffic (e.g. total)') parser.add_argument('--available_traffic', required=True, help='Amount of available traffic (e.g. 2TB or 0 for unlimited)') args = parser.parse_args() # Start Prometheus metrics server start_http_server(9112) while True: update_metrics(args.available_traffic_cycle, args.available_traffic_direction, args.available_traffic) time.sleep(60) # Update every 60 seconds
创建 vnstat_exporter 服务
vim /etc/systemd/system/vnstat_exporter.service[Unit] Description=vnstat exporter [Service] ExecStart=/usr/bin/python3 /usr/local/bin/vnstat_exporter.py \ --available_traffic_cycle "Monthly" \ --available_traffic_direction "In/Out" \ --available_traffic "2TB" WorkingDirectory=/root Restart=always User=root [Install] WantedBy=multi-user.target- 修改其中的
available_traffic_cycleavailable_traffic_directionavailable_traffic available_traffic0 为无限systemctl daemon-reload systemctl enable --now vnstat_exporter
- 修改其中的
现在可以前往
<Server IP>:9112/metrics查看输出信息,如果没有稍等五分钟启用防火墙
ufw allow from <Server IP> to any port 9112 comment 'vnstat_exporter'
(Server) Add Clients to Server
编辑 Prometheus 配置
vim /etc/prometheus/prometheus.ymlscrape_configs: # The job name is added as a label `job=<job_name>` to any timeseries scraped from this config. - job_name: "prometheus" # metrics_path defaults to '/metrics' # scheme defaults to 'http'. static_configs: - targets: ["localhost:9090"] - job_name: "remote_collector" scrape_interval: 1m static_configs: - targets: ["<Client 1 IP>:9100", "<Client 2 IP>:9100"] relabel_configs: - source_labels: [__address__] target_label: instance replacement: '<Client 1 Name>' regex: '<Client 1 IP>:9100' - source_labels: [__address__] target_label: instance replacement: '<Client 2 Name>' regex: '<Client 2 IP>:9100' # 添加以下内容 - job_name: 'vnstat_exporter' scrape_interval: 1m static_configs: - targets: ["<Client 1 IP>:9112", "<Client 2 IP>:9112"] relabel_configs: - source_labels: [__address__] target_label: instance replacement: '<Client 1 Name>' regex: '<Client 1 IP>:9112' - source_labels: [__address__] target_label: instance replacement: '<Client 2 Name>' regex: '<Client 2 IP>:9112'添加 Grafana 变量
在 Dashboard 点击
齿轮,Variables,+ New variableName:
Traffic_UnitLabel:
Traffic UnitQuery type:
Label valuesLabel:
time_unitMetric:
vnstat_traffic点击
Apply
配置 Grafana 面板
点击
Add,Visualization,Query 里选择Code,输入出口流量
vnstat_traffic{time_unit="$Traffic_Unit",type="total",direction="out",instance="$node"}入口流量
vnstat_traffic{time_unit="$Traffic_Unit",type="total",direction="in",instance="$node"}双向流量
vnstat_traffic{time_unit="$Traffic_Unit",type="total",direction="total",instance="$node"}- 可用流量
available_traffic{instance="$node"}- 流量方向
available_traffic{instance="$node"}下方
Options,Legend选择Custom,输入{{available_traffic_direction}}右侧搜索
Text mode选择Name流量周期
available_traffic{instance="$node"}下方
Options,Legend选择Custom,输入{{available_traffic_cycle}}右侧搜索
Text mode选择Name- 右侧选项
Standard Option,Unit选择bytes(IEC)
此时可以在顶上 Host 选择主机、在 Traffic Unit 选择统计周期
服务器续费信息
(Clients) server_exporter
vim /usr/local/bin/server_exporter.pyfrom prometheus_client import start_http_server, Gauge
import time
import argparse
# Define Prometheus metrics
renewal_date_gauge = Gauge('renewal_date', 'Renewal date of the service (timestamp)',
['renewal_cycle'])
renewal_price_gauge = Gauge('renewal_price', 'Renewal price of the service',
['renewal_currency'])
def update_metrics(renewal_date, renewal_cycle, renewal_price, renewal_currency):
"""
Update Prometheus metrics
"""
# Convert renewal date to timestamp
try:
# Here we assume renewal_date is a valid date string, e.g., '2024-12-31'
timestamp = time.mktime(time.strptime(renewal_date, '%Y-%m-%d'))
renewal_date_gauge.labels(renewal_cycle=renewal_cycle).set(timestamp)
except ValueError as e:
print(f"Invalid renewal date format: {renewal_date}. Error: {e}")
# Update renewal price metric
try:
renewal_price_value = float(renewal_price) # Ensure price is a number
renewal_price_gauge.labels(renewal_currency=renewal_currency).set(renewal_price_value)
except ValueError as e:
print(f"Invalid renewal price format: {renewal_price}. Error: {e}")
if __name__ == '__main__':
# Argument parsing
parser = argparse.ArgumentParser(description='Renewal information exporter for Prometheus')
parser.add_argument('--renewal_date', required=True, help='Renewal date of the service (e.g. YYYY-MM-DD)')
parser.add_argument('--renewal_cycle', required=True, help='Renewal cycle (e.g. monthly, yearly)')
parser.add_argument('--renewal_price', required=True, help='Renewal price (e.g. 29.99)')
parser.add_argument('--renewal_currency', required=True, help='Currency for the renewal price (e.g. USD, EUR)')
args = parser.parse_args()
# Start Prometheus metrics server
start_http_server(9113) # Use a different port to avoid conflicts with vnstat_exporter
while True:
update_metrics(args.renewal_date, args.renewal_cycle, args.renewal_price, args.renewal_currency)
time.sleep(60*60*24) # Update once a dayvim /etc/systemd/system/server_exporter.service[Unit]
Description=server exporter
[Service]
ExecStart=/usr/bin/python3 /usr/local/bin/server_exporter.py \
--renewal_date "2024-12-31" \
--renewal_cycle "Annually" \
--renewal_price "12.34" \
--renewal_currency "USD"
WorkingDirectory=/root
Restart=always
User=root
[Install]
WantedBy=multi-user.targetsystemctl daemon-reload
systemctl enable --now server_exporter
ufw allow from <Server IP> to any port 9113 comment 'server_exporter'(Server) Add Clients to Server
编辑 Prometheus 配置
vim /etc/prometheus/prometheus.ymlscrape_configs: # The job name is added as a label `job=<job_name>` to any timeseries scraped from this config. - job_name: "prometheus" # metrics_path defaults to '/metrics' # scheme defaults to 'http'. static_configs: - targets: ["localhost:9090"] - job_name: "remote_collector" scrape_interval: 1m static_configs: - targets: ["<Client 1 IP>:9100", "<Client 2 IP>:9100"] relabel_configs: - source_labels: [__address__] target_label: instance replacement: '<Client 1 Name>' regex: '<Client 1 IP>:9100' - source_labels: [__address__] target_label: instance replacement: '<Client 2 Name>' regex: '<Client 2 IP>:9100' - job_name: 'vnstat_exporter' scrape_interval: 1m static_configs: - targets: ["<Client 1 IP>:9112", "<Client 2 IP>:9112"] relabel_configs: - source_labels: [__address__] target_label: instance replacement: '<Client 1 Name>' regex: '<Client 1 IP>:9112' - source_labels: [__address__] target_label: instance replacement: '<Client 2 Name>' regex: '<Client 2 IP>:9112' # 添加以下内容 - job_name: 'server_exporter' scrape_interval: 1d static_configs: - targets: ["<Client 1 IP>:9113", "<Client 2 IP>:9113"] relabel_configs: - source_labels: [__address__] target_label: instance replacement: '<Client 1 Name>' regex: '<Client 1 IP>:9113' - source_labels: [__address__] target_label: instance replacement: '<Client 2 Name>' regex: '<Client 2 IP>:9113'在 Grafana 中添加面板
参考可用流量的设置
续费日期
renewal_date{instance=~"$host"} * 1000- 下方
Options,Legend选择Custom,输入{{renewal_cycle}} - 右侧删除面板标题
- 下方
续费价格
renewal_price{instance=~"$host"}- 下方
Options,Legend选择Custom,输入{{renewal_currency}} - 右侧删除面板标题
- 下方